Gross profit is one of the most important metrics to understand for your business. In this guide we’ll show you how you can quickly and easily create a gross profit analysis report inside growyze, showing sales data, expected gross profit and variances between your figures.
1. Create a new GP Analysis report
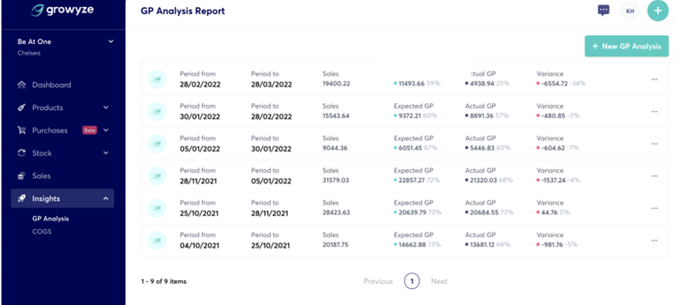
From the left-hand menu choose ‘Insights” and ‘GP Analysis’ and then select ‘New GP Analysis’ to create a new report.

2. Select your information
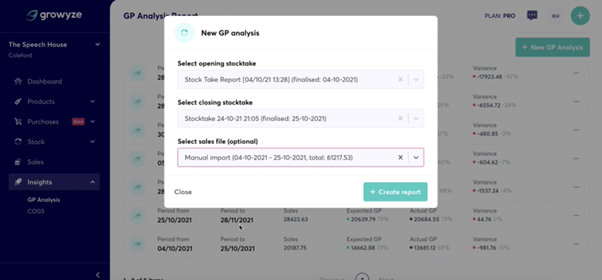
Here, you’ll need to choose the information to outline what period the gross profit analysis should occur in. Choose your opening stocktake, closing stocktake and the corresponding sales data from the dropdown options:

Once you are happy with your selection choose ‘+Create report’.
3. Analyse the report
Once the report has been created you can view a top-line overview of information for that period including:
- The period date
- Sales figure
- Expected gross profit figure
- Actual gross profit figure
- Variance between expected and actual gross profit
This helps you to see, at a glance, the gap between what your gross profit should be, and what has actually been recorded.
To delve into the report details you can click the green icon next to the report you wish to view.

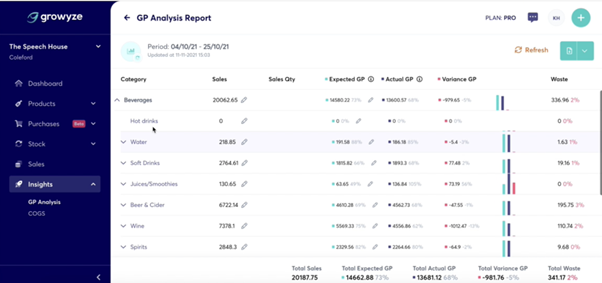
This will load all of the details of the report by categories, subcategories and individual line items.
From this, you can easily see where you have variance, allowing you to investigate further.
4. Download the report
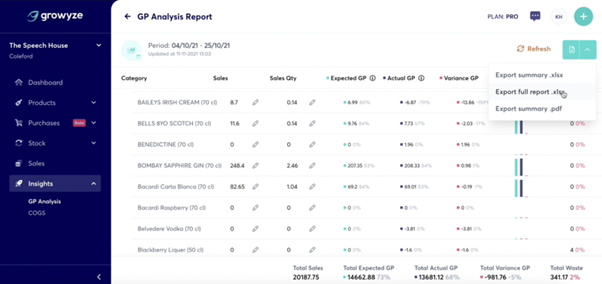
If you wish you can download the report. Click the download button on the top right-hand side and choose whether to export the report summary or full file, either by PDF or Excel spreadsheet.

For further help using growyze contact us at support@growyze.com


